Thursday, October 13, 2005

Chapter 3 (2): Pore it on!

Those of us who got our neuroscience education recently are raised from our undergraduate days to think that electric currents across the membrane are generated from ion flow through pores in channels. While true, it is easy to lose appreciation for the fact that this was hard-fought knowledge and things could have turned out quite differently. There are multiple lines of converging evidence for a pore which I'll review now.

TEA studies (Armstrong)
When TEA (a K-channel antagonist) is introduced intracellularly, it can be dislodged when the cell is hyperpolarized below Ek so K+ flows in. The fact that K+ can flow into, but not out of, TEA-blocked cells, suggests that TEA sticks in a cavity on the intracellular side, but can be dislodged by inflow of K+. [Ch 16]

Armstrong, based on further studies with TEA, also calculated that 600 K+ ions/ms flow out of a channel. Physically speaking, this seems too high for a carrier, too high for most enzymes, but well within possibilities for a pore. [Ch 11]

Ion selectivity of channels
Channels are permeable to ions only up to a certain size [Ch 14]. "Such size selection suggested a pore acting as an atomic mechanical sieve" (p. 72).

Pre-crystal structural evidence
Based on sequence information, which can be used to generate hydropathy plots (plots which show stretches of hydrophobic/hydrophilic protein) are used to infer the tertiary structure of channels in vivo. All voltage-gated channels consist of four domains (each containing six transmembrane spanning segments) that are either covalently linked (Na, Ca) or form by oligomerization of such subunits (K channels). This sequence information also allows us to study the effects of mutation on channel function (e.g., effects on ion flow, toxin-receptor interaction, and gating currents). Such molecular models suggest that each domain has a length of molecules that faces an internal pore. An excellent overview is provided in the following figure and text are from Catterall's group:
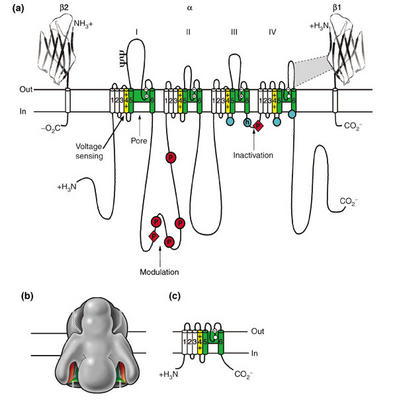
"Sodium-channel proteins in the mammalian brain are composed of a complex of a 260 kDa α subunit in association with one or more auxiliary β subunits (β1, β2 and/or β3) of 33-36 kDa [3] ([See accompanying figure: click on it for a larger version]). Nine α subunits (Nav1.1-Nav1.9) have been functionally characterized, and a tenth related isoform (Nax) may also function as a Na+ channel. The primary sequence predicts that the sodium channel α subunit folds into four domains (I-IV), which are similar to one another and contain six α-helical transmembrane segments (S1-S6). In each of the domains, the voltage sensor is located in the S4 segments, which contain positively charged amino-acid residues in every third position. A re-entrant loop between helices S5 and S6 is embedded into the transmembrane region of the channel to form the narrow, ion-selective filter at the extracellular end of the pore. The wider intracellular end of the pore is formed by the four S6 segments. Small extracellular loops connect the transmembrane segments, with the largest ones connecting the S5 or S6 segments to the membrane re-entrant loop. Larger intracellular loops link the four homologous domains. Large amino-terminal and carboxy-terminal tail domains also contribute to the internal face of the sodium channel. This view of sodium channel architecture has been largely confirmed by biochemical, electrophysiological, and structural experiments."

Crytallography
In the above paper, Catterall goes on to state that "A complete three-dimensional structure of the sodium channel is not yet available." The same is not true of the voltage-gated K channel. KcsA, a K channel found in the bacterium Streptomyces livedans has been successfully crystallized and visualized (Plates 2c and 2d). As expected, the channel shows a narrow pore through which K+ ions can flow.

Patch clamp
Hille's description of this seminal work introduced by Neher and Sakmann in 1976 is excellent, so I won't use much bandwidth summarizing it here. Essentially, they learned how to form high resistance seals with small areas of the cell membrane, even to the point where we can measure currents generated by single channels. The ability to record the activity of single proteins in vivo is extremely rare in biology. See figures 3.16 and 3.17 for traces of currents through Na- and K- channels. These studies have shown that the opening/closing of channels is extremly rapid, operating on time scales smaller than the microsecond. Also, it has been possible to calculate that individual ions traverse the length of the channel very quickly, on the order of nanoseconds. This fact alone makes all but the pore hypothesis untenable.

Wednesday, September 28, 2005

Chapter 3 (1): Toxins to the Rescue

Chapter 2 outlined the HH theory of the action potential: when they wrote their papers, nobody yet knew the mechanism of current flow. From p 61:
A variety of mechanisms were considered possible. These included permeation in a homogeneous membrane, binding and migration along charged sites, passage on carriers, and flow through pores...The pathways might be formed from phospholipid or from protein, or even from nucleic acid. Each of these ideas was seriously advanced and rationalized in published articles.

Between the early 1960s and 1976 (in 1976 Neher and Sakmann published the first single channel patch recording), the mystery of the currents was essentially solved. First, in the 1960s toxins were found that could selectively block Ina (TTX and STX) or Ik (TEA) while the other current remained unaltered (Figure 3.2). This, in addition to the results of HH's ion substitution experiments, was taken as evidence that there were two separate ion pathways, or channels, one for K and one for Na.

The discovery of neurotoxins has been a boon for neuroscience. In addition to letting us turn individual currents on and off at will, they have helped us count individual channels (channel density is an important parameter in realistic neuronal models), and have suggested structural models of channels.

Counting Channels
The action of TEA, TTX, and STX is well-described by a simple model in which a single molecule of the toxin T binds reversibly to a single receptor site R in an individual channel. This model is represented in Equation 3.1. The strength of binding is given by the equilibrium dissociation constant Kd. Kd is the toxin concentration at which half of the available receptors are occupied by the toxin. The model allows for a relatively simple algebraic derivation of the proportion of bound receptors, denoted with the variable y (see equation 3.2 and Figure 3.3).

If the above is unfamiliar, I highly recommend reading this site for a good introduction to the kinetics of such ligand-receptor interactions, which includes a discussion of Kd. As usual, Hille is leaving out lots of details in his exposition, but his terse summaries are very accurate.

The simple model of toxin-receptor interactions described above allows us to directly estimate the number of receptor sites, Bmax in a preparation. This is typically done with radioactively labeled toxins denoted radioligands. After marinating the preparation with radioligand, the preparation is thoroughly washed out to remove all the radioligand that is not bound to the receptor. Often it is washed out with a specific competitor such as a nonradioactive form of the toxin. If the radioligand only bound to the receptor, then estimating Bmax, the number of receptors in the tissue, would be relatively simple. We could apply different concentrations of radioligand and fit the data to the equation Bmaxy, where y is the proportion of bound receptors as a function of toxin concentration (Equation 3.2), and Bmax is the number of radioligand molecules at saturation. Note that Bmaxy is the first term in Equation 3.4.

Unfortunately, reality isn't quite so simple: we are never able to wash out all of the radioligand that isn't bound to receptor. It binds "nonspecifically" to other molecules in the preparation. Indeed, there is evidence that certain drugs bind to the plastic out of which test tubes are made! Luckily, this general, nonspecific binding typically has very different properties than the toxin-receptor binding: it is a linear nonsaturating function (i.e., the radioligand remaining after washout continues to increase linearly without bound as the concentration of radioligand is increased). Because of such nonspecific binding, a second linear term must be added to the saturating function, as represented by the right-hand term a[T] in Equation 3.4. [T] is the toxin concentration and a is a free parameter that represents the slope of the linear relationship.

Figure 3.4 shows the various curves we have discussed in the context of a clever experiment. The amount of radiolabeled STX was measured at different concentrations before and after wash with a high concentration of TTX, which has a higher affinity for the Na-channel receptor than STX. The remaining radiolableed STX was due to nonspecific binding, and exhibits the expected linear relationship with STX concentration. The difference between the linear curve and the overall saturating curve observed before TTX wash reveals the amount of radioligand remaining due to specific binding of STX to the Na-receptor. Such data has shown us that the Na-channel density on membrane is about 100-400 channels per square micron of unmyelenated axon.

Initial channel models
In addition to helping us count receptors, toxins have helped generate predictions about channel structure. For instance, a model of K channels was suggested by the effects of intracellular TEA on Ik. Namely, intracellular TEA blocks Ik only in open channels (a phenomenon known as open channel block (Figure 3.5). This suggested that the channel is a pore with a wide cytoplasmic opening (large enough for a big toxin like TEA to block it), an opening which is typically blocked by a gate that moves out of the way when the channel opens, thus allowing TEA to enter and close the channel. Because the toxin does not simply flow out of the extracellular pore, the model also assumes that the pore narrows toward the extracellular side. A cartoon of this model of the voltage-gated channel is shown in Figure 3.6. I

Wednesday, September 21, 2005

Chapter 2 (3): Gating charges and gating currents

Hille discusses gating currents at greater length in later chapters (e.g., Chapters 9, 12, 18, and 19), and he will explicitly draw on the material from Chapter 2. Hence, I thought the topic deserved a few bits of bandwidth.

In the HH model of voltage-gated Na and K channels, there exist gating particles that respond to changes in voltage and thereby switch between the permissive and nonpermissive state (these are the m- and h-gates in the Na-channel and n-gates in the K-channel). The voltage-dependent changes in these molecular gates are thought to result from the interaction of Vm with charged amino acids in the channel, interactions that cause these miniature voltage sensors to move, or translocate, within the cell membrane. Since channels open during depolarization, we would expect positive gating charges to move in the extracellular direction when they enter the permissive state (equivalently, negative gating charges should move toward the inside of the cell).

Movement of a charge across the membrane is a current, the gating current, that should be observable (p. 57):
Hodgkin and Huxley pointed out that the necessary movement of charged gating particles within the membrane should also be detectable in a voltage clamp as a small electric current that would precede the ionic currents. At first the term "carrier current" was used for the proposed charge movement, but since we no longer think of channels as carriers, the term gating current is now universally used.
The empirical measurement of gating currents wasn't actually performed until the early 70s.

Hille provides a brief summary of how to use general energetic considerations to calculate the number of charges that the voltage sensor contains, the gating charge. First, recall from chemistry that a protein can exist in many conformational states, and the energy associated with each conformation forms a "conformation energy landscape", a bumpy terrain usually with lots of local minima separated by hills that represent the energy needed to make the transition between the conformations. So we can assume that even when a channel is not subject to a voltage across the membrane, the conformational energy of a channel in the closed state is X, its conformational energy in the open state is X+w, and hence the difference in energy between the two conformations is w.

It is important to note that the conformational change in the channel takes place in a voltage field Vm. By hypothesis, the gating particle has a charge Q (Q=zgqe where qe is the elementary charge and zg is the number of charges) and the sensor must move against Vm. Hence, in addition to the purely conformational energy change described above, at a fixed Vm, the work done (i.e., energy) to move the charge from the intracellular to the extracellular edge of the membrane is -QVm (recall V is in J/Coulomb, so the units work out). This charge movement is exactly analogous to lifting a baseball above the ground and building up potential energy: similarly, a positive charge Q held just at the edge of the extracellular membrane will be pushed toward the intracellular side when the cell is at a hyperpolarized Vm. More explicitly, if the electrical potential in the closed state is Y, then the potential in the open state is Y-QVm, and the change in the electrical potential is -QVm. The sign is negative because we want a positive potential difference when the cell is hyperpolarized.

We can then examine both energies (conformational and electrical potential) simultaneously. The total energy associated with the closed state is Eclosed=X+Y, that associated with the open state is Eopen=(X+w)+(Y-QVm). Hence, the change in energy associated with the transition from the closed to open state is Eopen-Eclosed=w-QVm. Since we are describing a channel with only two states, and we know the energy difference between the states, we can apply the Boltzmann equation to describe the ratio of open to closed channels at thermodynamic equilibrium: it is a decaying exponential function of (w-QVm) [see Equations 2.21 and 2.22].

If you substitute zgqe for Q in the Boltzmann distribution, you can fit the observed proportion of open channels to the Boltzmann distribution using different values of zg, and thereby get an estimate of the number of charges in the voltage sensor (Figure 2.20). Technically, the best fit only provides a lower bound on the number of charges in the voltage sensor. This is because the above calculation assumes that zg charges move completely from the inside of the membrane to the outside. However, the same electrical potential -QVm could be generated by moving a greater number of charges partly across the membrane. Indeed, this is now thought to be exactly what happens.

Tuesday, August 30, 2005

Chapter 2 (2) : HH Conductance Model

The previous post summarized, in somewhat qualitative terms, the HH model of the action potential. Since then, I've written up a supplement to Hille's description of their quantitative model. It is available online as HH_Conduct.pdf. It goes into a little more detail than Hille about their model. For instance, it motivates and describes the equation they actually used to fit their gk data, thus explicitly connecting their speculative lower-level model (in terms of charged 'gating particles') to observed macroscopic conductances. The first paragraph follows.

Hodgkin and Huxley (HH) were able to reliably measure the voltage- and time-dependent changes in sodium and potassium conductance (gna and gk) during the action potential (Figure 2.11 [Hille]). The story that emerged from such experiments is now part of the core knowledge of all neurophysiologists. After a suprathreshold voltage step, gna quickly rises and falls while gk slowly increases to a steady state (Figure 2.11 [Hille]). In a cell that is not voltage-clamped, this increase in gna causes Vm to rapidly approach Ena. However, the subsequent gk increase, and gna decrease, causes Vm to quickly fall back down to the resting potential near Ek. HH quantified these conductance changes in a model with explanatory and predictive power that only continues to grow. In what follows, I will describe in more detail their model of gk and gna.

Each time I revisit the HH corpus, I am impressed by their profound creativity, technical skills (both quantitative and experimental), and luck.

Monday, August 29, 2005

Chapter 2 (1): Classical Biophysics of the Action Potential

Last updated 9/01/05
In Chapter 2, Hille provides an excellent summary of the classical period in biophysics that culminated in the Hodgkin-Huxley papers of 1952. This work on the squid giant axon laid the foundation for thinking about the electrical properties of neurons that has persisted to this day.

Bernstein's membrane hypothesis
Bernstein was the first physiologist to hypothesize that action potentials result from transient changes in membrane permeability to ions. Based partly on the work of Nernst, he hypothesized that at rest the neuronal membrane was selectively permeable to K ions, and that during an action potential there was a reversible 'breakdown' of the cell membrane so that it became nonselectively permeable to all ions. Such a breakdown would cause Vm to shoot up to zero.

Right before WWII, when Cole and Hodgkin's groups were finally able to accurately measure membrane voltage with intracellular electrodes, they discovered that something had to be wrong with Bernstein's hypothesis: Vm shot up past zero during an action potential (Figure 2.1). After the war, Hodgkin's group was finally able to experimentally attack the cause of the overshoot. They surmised that, instead of becoming permeable to all ions, the membrane became selectively permeable to sodium ions, which they knew from Nernst had a resting potential well over zero mV.

Hodgkin and Huxley crack the action potential
Hodgkin and Katz, in 1949, confirmed their sodium hypothesis by decreasing the Na-concentration in the extracellular fluid and observing a reduction in the amplitude of the action potential. They also showed that, when the extracellular K concentration was reduced, the resting potential of the cell became less hyperpolarized.

The development of the technology to clamp the voltage across the membrane of the squid giant axon was the driving force behind their solution to the action potential problem. It allowed them to hold Vm at a particular voltage (Vclamp) while measuring the current across the membrane (Im) (Figure 2.6). By combining voltage clamp with ionic substitution experiments they were able to more precisely characterize the ionic basis of the action potential. For instance, they predicted and confirmed that when Vclamp was above Ena, the current would switch from negative (inward) to positive (outward) (Figure 2.7). They hypothesized that the action potential could be generated solely by voltage-dependent Na and K currents (i.e., Im=Ina+Ik). When they replaced extracellular Na with an impermeant cation, clamping the cell at any voltage above Ek generated only outward currents, which they took to be Ik. By subtracting Ik from the membrane current Im observed in normal conditions, they were able to infer Ina during an action potential (Figure 2.8). They applied this method at multiple values of Vclamp, generating Figure 2.9, which plots steady-state Ik and peak Ina as a function of Vclamp.

Since from Ohm's law we know that for ion species i, gi=Ii/(Vm-Ei), they were able to track the voltage and time-dependent changes in gna and gk during the action potential (Figure 2.11). The story that emerged from such experiments is now well-known to all neurophysiologists. After a suprathreshold voltage step, gna quickly increases(and then decreases), while gk increases to a steady state (Figure 2.11). This causes Vm to quickly approach Ena, but then when gk increases (and gna decreases), the cell quickly comes back down to the resting potential near Ek.

What causes these changes in gk and gna? HH hypothesized that the gna change is actually due to two types of processes in the channel: activation (m) and inactivation (h). These processes are referred to as 'gates' or 'gating variables'or 'particles'. Each of these gates can be in a permissive (activated/de-inactivated) or nonpermissive (de-activated/inactivated) state: a channel is open only when all of the gates are in the permissive state. Unlike the sodium channel, the voltage-gated K channels have only one type of gate, which is either activated or deactivated (n). At Erest, most Na channels are closed: while h tends to be in the permissive (deinactivated) state, the m gate tends to be in the nonpermissive, deactivated state. When the voltage rises, m tends to become activated very quickly. At this time, when m and h are both in the permissive state, the Na channel opens and sodium flows into the cell. This action current generates a brief and fast rise in Vm: the action potential. This rapid depolarization causes the Na channel to inactivate (i.e., h tends toward the nonpermissive state), shutting off the current flow. Compounding this insult to Na, the depolarization also causes m, the gating element in the potassium channel, to enter the permissive state (i.e., the K channel is activated), which causes Vm to drop back down toward Erest. This hyperpolarization resets the whole process. Back down at baseline, the K channels inactivate and the Na channels become de-inactivated (while remaining deactivated), so the cell is poised to spike once again. The above menagerie of permissive and nonpermissive gate states can be confusing, but it's the biological reality evolution stuck us with, and is so important in neuroscience it is worth taking the time to grok.

In the next post, I will summarize Hille's more quantitative description of the Hodgkin-Huxley model and add more details to the above qualitative summary. Then, I will describe gating currents, about which two Nature papers were published just last month, which settles an open question at the time of publication of ICEM.

Monday, August 22, 2005

Differential equations primer

Since first-order differential equations come up fairly frequently in Hille (and in any quantitative treatment of anything in science, for that matter), I have spent the past week writing up a primer on first-order differential equations for neuroscientists. You can download it here: Diff_Eq.pdf.

Here is the introductory section of the manuscript:
Ordinary first-order differential equations come up repeatedly in neuroscience. They are used to model many fundamental processes such as passive membrane dynamics and gating kinetics in individual ion channels. When the equations come up, most electrophysiology texts provide the solution, but do not provide any explanation. This manuscript tries to fill the gap, providing an introduction to some of the mathematical facets of first-order differential equations. While the main goal of this manuscript is to examine the equations neurophysiology texts present without justification, I pushed the proofs to the end of the manuscript so that those who wish to skip them don't have to waste time working out which pages to skip. The manuscript, including the proofs, presupposes a little knowledge of first-year calculus, much of which is reviewed when needed.

The manuscript has three sections. Section One provides a brief statement of the general problem and its solution. Section Two examines the solution for a special case that comes up quite frequently in practice, and also examines a concrete example, the equivalent circuit model of a patch of neuronal membrane. Section Three contains a simple derivation of the general solution given in Section One.

There is a Matlab function that accompanies it which you can use to simulate the equivalent circuit model I go over in the document. You can get the code here: equiv_circuit_plot.m. Feel free to suggest improvements to the code.

I welcome any criticisms of content, clarity, or formatting. I hope it can serve as a useful reference to explain all those taus and infinities in Hille's treatment of the Hodgkin-Huxley equations in Chapter 2, which I'll post about next week.
Update 8/27/05: Version 0.2 of the document is up. I have retooled the document so that the connection with Hodgkin-Huxley is more transparent, and so those who want to avoid proofs can do so while still learning some differential equations (NB: skipping proofs causes warts).

Thursday, August 11, 2005

Summaries update

I am presently writing a summary of Chapter 2 of ICEM. I'll be on vacation the next few days, but it should be done sometime next week. While I am happy to continue providing summaries, I'd be even happier if anybody out there wants to contribute one! If interested, please email me to let me know what chapter and we'll discuss the details.

Tuesday, August 09, 2005

Useful software

David Touretzky and others at CMU have written a great program called HHsim: Graphical Hodgkin-Huxley Simulator. If you want to actually tinker with the variables discussed in Chapters 1 and 2 of ICEM, it provides a great platform. It is a stand-alone implementation of the HH model of the squid giant axon (Chapter 2 of ICEM), and lets you play around with current clamp, voltage clamp, and tweak all the parameters in the HH model while seeing the results in real time. As they describe in a set of possible virtual experiments, you can also use HHsim to explore the Nernst equation as well as resting potential, so it is a useful supplement to Chapter 1 of ICEM as well. Also, installation is painless (just download the executable and double click: it will install and then you can click on the desktop icon to run it).

HHsim is educational software good for exploring some key biophysical concepts. If you actually want to construct your own models using the channels discussed in ICEM, then you will need to go to a modeling platform, most likely Genesis (their book is now available free online here), Neuron (they are finally putting out a book this year), or XPP-Aut, an underappreciated analysis tool maintained by Bard Ermentrout (book available here and helpful tutorial available here). If I have missed any software, please let me know and I'll put it in the sidebar.

Note: I am following along ICEM using Genesis, and may post some Genesis-specific posts separate from the other posts. If you are interested in doing the same, and are on a Windows machine, you should probably go through the installation hell now, as it will likely take you a few hours of labor to get it working. Once working, it is worth the initial effort.

Monday, August 08, 2005

Chapter 1: Introduction

In this introductory chapter Hille provides general background that should serve as a useful reference for the rest of the book. Even in this chapter, the density of the book, and its sometimes frustrating tendency to quickly make arcane technical points as if they were part of the average neuroscientist's working knowledge, is exhibited in full force (see pages 14-15 for his derivation of the Nernst equation for an example). This is why I thought it would be a good book for discussion.

Chapter 1: Introduction
There are two main types of transport processes that give excitable cells their electrical phenotypes: ion channels and carrier molecules. The carrier molecules establish the overall ion gradients across neuronal membranes, while ion channels are responsible for fast changes in the electrical properties of cells. Ion channels, such as voltage-gated sodium channels, are water-filled pores through which ions travel. Carrier molecules, such as the sodium-potassium pump, are large proteins embedded in the cell membrane whose binding sites are thought to be alternatively exposed on the extracellular and cytoplasmic surfaces. Carrier molecule function is still not very well understood.

Neurons are usefully represented by equivalent circuit models which recreate their I-V relations. Cells are often represented by a capacitor in parallel with resistors, with the capacitor standing in for the cell membrane and the resistors standing in for ion channels. Recall from physics that the prototypical capacitor consists of two conducting plates separated by an insulating material. The cell membrane acts as a capacitor, with the cytoplasmic and extracellular spaces acting as conductors while the membrane is relatively insulating. Resistors in circuit theory are conductors of current, specifically conductors through which energy (electrical potential) is lost as heat. Hence, the overall picture we have of a neuron is a capacitor (cell membrane) in parallel with a resistor (the ion channels) [Figure 1.2].

In neurons, current flow is much more complicated than in electrical circuits because the current flow is caused by ion species traveling through aqueous pores, and these same ions set up the voltage gradient across the membrane. That is, voltage differences across the membrane is not caused by energy lost due to heat, but because the ion flow itself creates differences in the net charge across the membrane, and this induces an electrical field and an associated potential field. The second half of the book goes into great detail about the physics of these processes, but some important preliminary details are given in this chapter.

The Nernst Equation (Equation 1.10) describes how ion flow works in the simplest possible case: a membrane selectively permeable to only one ion species (e.g., K+), initially set up with different concentrations of that ion on the two sides of the membrane (Figure 1.4). There are two forces acting in such cases: the concentration difference effectively sets up diffusional forces that push the ion from the side of higher concentration to that of lower concentration. Passage of ions down this diffusion gradient then sets up a voltage gradient, whose force acts in the direction opposite to that of the diffusional gradient. Mathematically, you can solve for the case in which the forces due to diffusion and electrical potential cancel out, and the solution is the Nernst equation:

Eeqm = Ein-Eout = (RT/F) ln ([ion]out/[ion]in)

In words, the potential difference across the membrane will exactly counteract the diffusion pressure when enough ions have passed through the membrane to set up Eeqm. When the voltage across the membrane is equal to Eeqm, the net ion flow through the membrane is zero. Note that in physiological systems it takes very few ions to set up the required voltage difference, so the ion concentrations remain relatively unchanged. For instance, the concentration of K+ ions remains very high on the inside of a cell even when it is at Ek.

At rest, the neural membrane is not permeable to only one ion species, so to calculate the potential at which the net current flow is zero across the membrane, we cannot simply rely on the Nernst equation. In such cases, the GHK (Goldman-Hodgkin-Katz) equations describe how to calculate the voltage-difference Er (the resting potential) at which the net current flow through the membrane is zero.

Because of the ionic basis of membrane currents, we can't simply apply Ohms law (I= gV) to cell membranes. Such an analysis would predict that zero current would be flowing through an ion channel when the voltage difference across the membrane is zero. We typically have zero current flowing when V=Eeqm, calculated using the GHK equation, so we need to replace Ohm's law from electric circuits with I=g(V-Eeqm) to accurately recreate neuronal behavior. When a channel is selectively permeable to only one ion, then Eeqm for that channel can be calculated using the Nernst equation.

Finally, as Hille shows by working through in a few examples in Figure 1.6, the conductance in the equation I=g(V-Eeqm)is rarely fixed in time. It is often a function of the voltage across the membrane, which gives neurons some of their most interesting behavior. Before moving on to Part I of ICEM, I would recommend thorougly working through the examples in Figure 1.6, as it is a very useful intuition pump in which Hille first considers the behavior of simple Ohmic channels and builds up to more realistic voltage-dependent channels with nonzero equilibrium potentials. It is probably the most important figure of the chapter.

Kandel and Schwartz (Chapter 6) and this site have good discussions of the Nernst equation. Johnston and Wu derive it from basic principles.

Thursday, July 28, 2005

ICEM: Table of Contents

Here is the Table of Contents of Ion Channels of Excitable Membranes. As we progress through the book, to each chapter title below will be added a link to the first post on that chapter.

Chapter 1: Introduction

Part I: Description of Channels
Chapter 2: Classical biophysics of the squid giant axon
Chapter 3: The superfamily of voltage-gated channels
Chapter 4: Voltage-gated calcium channels
Chapter 5: Potassium channels and chloride channels
Chapter 6: Ligand-gated channels of fast chemical synapses
Chapter 7: Modulation, slow synaptic action, and second messengers
Chapter 8: Sensory transduction and excitable cells
Chapter 9: Calcium dynamics, epithelial transport, and intercellular coupling

Part II: Principles and mechanisms of function
Chapter 10: Elementary properties of ions in solution
Chapter 11: Elementary properties of pores
Chapter 12: Counting channels and measuring fluctuations
Chapter 13: Structure of channel proteins
Chapter 14: Selective permeability: independence
Chapter 15: Selective permeability: saturation and binding
Chapter 16: Classical mechanisms of block
Chapter 17: Structure-function studies of permeation and block
Chapter 18: Gating mechanisms: kinetic thinking
Chapter 19: Gating: voltage sensing and inactivation
Chapter 20: Modification of gating in voltage-sensitive channels
Chapter 21: Cell biology and channels
Chapter 22: Evolution and origins

Wednesday, June 15, 2005

Neuro geeks of the world unite!

Welcome to Neurochannels, a blog where we will discuss a series of neuroscience books. The idea of starting a blog was suggested, with ambiguous seriousness, by Serapio Baca. The first book will be the third edition of Bertil Hille's classic Ion Channels of Excitable Membranes. In fact, that book was the inspiration for the name of the blog. Expect the first post in early August.